Report: North Carolina's bioscience industry outpaces the nation
North Carolina's bioscience industry grew faster than the national industry average over the past four years and holds a mix of specialized strengths no other state matches, according to the 2026 edition of the U.S. Bioscience Economy, a report from TEConomy Partners and the Biotechnology Innovation Organization.
Bioscience employment in North Carolina rose 11.6% from 2021 through 2025, reaching 102,913 jobs at 6,781 business establishments. Employment in the national industry grew 7.0% over the same period.
North Carolina is also the only state with specialized employment concentrations in four of the industry's five subsectors and job growth in all five. The report places North Carolina in the top 10 states on every major measure in its state profile: employment, industry concentration, establishments, university research, National Institutes of Health funding, venture capital and patents.
What a specialized concentration means
The report measures concentration with a location quotient. An LQ compares an industry's share of a state's private-sector jobs with the same industry's share of jobs nationwide.
An LQ of 1.00 means the industry makes up the same share of jobs in the state as in the nation. An LQ of 2.00 means the industry's share of state jobs is twice the national share. The report defines a specialized concentration as an LQ of 1.20 or higher, or a share at least 20% above the national average.
North Carolina's bioscience industry as a whole has an LQ of 1.41. Bioscience jobs make up a 41% larger share of the state's private-sector employment than of national employment. Four of the five subsectors clear the 1.20 threshold:
|
Subsector |
Location quotient |
NC jobs, 2025 |
|
Pharmaceuticals |
2.35 |
26,999 |
|
Research, testing and medical laboratories |
1.58 |
38,912 |
|
Bioscience-related distribution |
1.23 |
25,824 |
|
Agricultural feedstock and industrial biosciences |
1.20 |
2,708 |
The fifth subsector, medical devices and equipment, employs 8,471 people in North Carolina and has an LQ of 0.62.
Why concentration matters
A specialized concentration marks an industry cluster: a group of related companies, suppliers, research institutions and workers in one place. Clusters give the companies inside them several advantages.
-
Talent: Companies draw from a deep pool of workers with specialized skills, and training programs grow to serve them.
-
Suppliers and services: Equipment vendors, contract manufacturers, testing labs and specialized service firms locate near their customers.
-
Research partners: Companies find university collaborators, licensing opportunities and clinical research sites close by.
-
Investment: A proven cluster lowers the risk of building or expanding a facility, which helps a state compete for new projects.
The national report makes the same point about biomanufacturing. According to the report, states compete for these facilities on full ecosystems of training, infrastructure, site readiness and partnerships, not on incentives alone.
Strength across several subsectors adds a second benefit: resilience. Each subsector responds to different market forces. Pharmaceutical manufacturing follows drug demand and supply chain decisions. Research and testing firms follow R&D budgets and investment cycles. Distribution follows healthcare delivery, and agricultural biosciences follow farm markets. A state with four specialized subsectors depends less on any single one.
North Carolina's record from 2021 to 2025 reflects this balance. Eight states and Puerto Rico hold specializations in three or more subsectors. Among states, only North Carolina holds four. All five North Carolina subsectors added jobs from 2021 to 2025, a period ending in a national hiring plateau.
Growth in a slower national market
The national bioscience industry employed 2.31 million people in 2025 and generated $3.19 trillion in total economic output, according to the report. National hiring rose 5.7% in 2022, then slowed. Bioscience employment fell 0.3% nationally in 2024 and rose 0.4% in 2025, leaving the industry about the same size as in 2023.
North Carolina outpaced those trends. The state added about 10,700 bioscience jobs from 2021 through 2025. The report lists North Carolina among the national leaders in total bioscience jobs added, behind Texas, Florida, Massachusetts and Illinois. Bioscience employment in North Carolina also grew faster than the state's overall private sector, which expanded 10.2% over the same period.
Three North Carolina subsectors grew more than twice as fast as their national counterparts:
|
Subsector |
NC growth, 2021-25 |
U.S. growth, 2021-25 |
|
Bioscience-related distribution |
26.1% |
10.7% |
|
Agricultural feedstock and industrial biosciences |
13.3% |
2.2% |
|
Pharmaceuticals |
12.6% |
5.4% |
Research, testing and medical laboratories, the state's largest subsector, added about 1,850 jobs, a 5.0% increase. Medical devices and equipment grew 1.8%, in line with the national rate of 1.9%.
Pharmaceuticals and biomanufacturing
Pharmaceuticals is North Carolina's most concentrated subsector, at more than twice the national level. The state's 26,999 pharmaceutical jobs account for 7.4% of national employment in the subsector. The report names North Carolina as one of five states with both a large share of national pharmaceutical employment and a specialized concentration, along with New Jersey, Illinois, Indiana and Pennsylvania.
North Carolina leads the nation in biological product manufacturing, the measure the report uses for biopharmaceutical biomanufacturing. The state employed 6,816 people in this industry in 2025, up 29.2% from 2021. The industry's LQ in North Carolina is 4.61, more than four and a half times the national concentration.
The report cites FUJIFILM Biotechnologies' $2 billion cell-culture manufacturing site in Holly Springs, announced with 725 projected jobs, as an example of new national biomanufacturing investment. The report also presents North Carolina's training system as a model for other states. The system links community college training, the BioWork certificate, BioNetwork, North Carolina State University's Biomanufacturing Training and Education Center, university programs and customized industry training. The report names the NC Biotechnology Center as an example of an organization coordinating a state bioscience cluster.
High-wage jobs
Bioscience workers in North Carolina earned an average of $135,364 in 2025, 88% more than the state's private-sector average of $72,186. Nationally, bioscience workers earn 84% more than the private-sector average.
Average bioscience wages in North Carolina rose 21.0% from 2021 through 2025, compared with 16.0% for the national industry. Wages in bioscience-related distribution averaged $148,352, the highest of the state's five subsectors.
A top-10 research and investment base
North Carolina ranks in the top 10 nationally on all five innovation totals in the report:
|
Measure |
North Carolina |
National rank |
|
Academic bioscience R&D, FY 2024 |
$3.38 billion |
5th |
|
NIH funding, FY 2025 |
$1.72 billion |
7th |
|
Venture capital, 2021-25 |
$6.38 billion |
7th |
|
Active clinical trials, 2021-25 |
8,040 |
8th |
|
Bioscience patents, 2021-25 |
4,844 |
10th |
Only six states appear in the top 10 on all five measures: California, Massachusetts, New York, Pennsylvania, Texas and North Carolina.
Bioscience accounts for 76% of academic research and development spending at North Carolina universities, compared with 63% nationally. Health sciences made up $2.27 billion of the state's total.
North Carolina bioscience companies attracted more than $1 billion in venture capital in each year from 2021 through 2025. Drug discovery companies received $2.46 billion over the period, the largest share. North Carolina inventors received between 907 and 1,030 bioscience patents each year, led by medical and surgical devices and by drugs and pharmaceuticals.
NIH funding declines
NIH funding fell sharply while the state's bioscience employment, establishments and wages grew. NIH awards to North Carolina institutions held mostly steady from FY 2021 through FY 2023, then fell in each of the next two years.
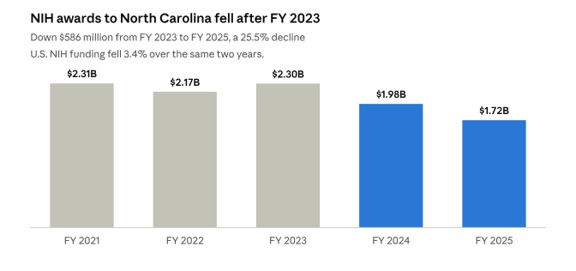
Awards fell $586 million, or 25.5%, from FY 2023 to FY 2025. National NIH funding fell 3.4% over the same period. The report names North Carolina among major recipient states with funding declines, along with Washington, Maryland and New York.
NIH awards support the basic research, scientific training and clinical research capacity behind new companies and licensing deals. The awards also support the research, testing and laboratory subsector, which employs more people than any other North Carolina bioscience subsector.
The report also notes an NIH accounting change in 2025. NIH recorded a larger share of awards up front as multiyear funding, which likely inflates FY 2025 totals.
Strengths across the state
Durham-Chapel Hill is one of five U.S. metro areas with specialized concentrations in four bioscience subsectors. Among large metros, Durham-Chapel Hill posts the highest concentration in the nation in three subsectors: pharmaceuticals; research, testing and medical laboratories; and bioscience-related distribution.
Raleigh-Cary and Rocky Mount each hold specializations in three subsectors. Nationally, 23 metros hold specializations in three or more subsectors. North Carolina claims three of them, second only to California's four.
Smaller North Carolina metros show the same depth. Rocky Mount and Greenville rank second and third among small metros nationally for pharmaceutical concentration. Burlington ranks first among small metros in research, testing and medical laboratories.
About the report
TEConomy Partners prepared the U.S. Bioscience Economy: Advancing Innovation and Strengthening States and Regions for BIO. The report covers 2021 through 2025. Employment, establishment and wage figures come from U.S. Bureau of Labor Statistics data enhanced by Lightcast. Research, NIH, clinical trial, venture capital and patent figures come from the National Science Foundation, NIH RePORT, ClinicalTrials.gov, PitchBook and the Clarivate Derwent patent database.